
Build Your Own Off-Grid Weather Station
A Raspberry Pi and SDR system for collecting local weather data without relying on anyone’s cloud.

This project documents how I built an off-grid weather station using a Raspberry Pi and an SDR receiver to collect, process, and store local weather data without relying on cloud services.
How I Ended Up Building a Weather Server
Let’s get this out of the way up front: I will try and not make this a deep technical dive. If you want the nuts-and-bolts detail, dig into the GitHub repo. There’s enough there to build it yourself, or at least steal the parts that matter.
What I’m doing here is the 30,000' foot view. But occasionally I will swoop down when necessary.
This is how some of my projects go. You fix one problem and set off a chain reaction. Three more issues surface, and before you know it, two weeks have gone by and you’ve built a weather station.
And before anyone asks why I didn’t just buy a cheap “all-in-one” weather station off Amazon: I already did. It worked great as a stopgap. But if you want real data, local storage, or customization, we can do better.
But the real story starts somewhere completely unrelated: my outdoor ADS-B crowdsourced feeder setup.
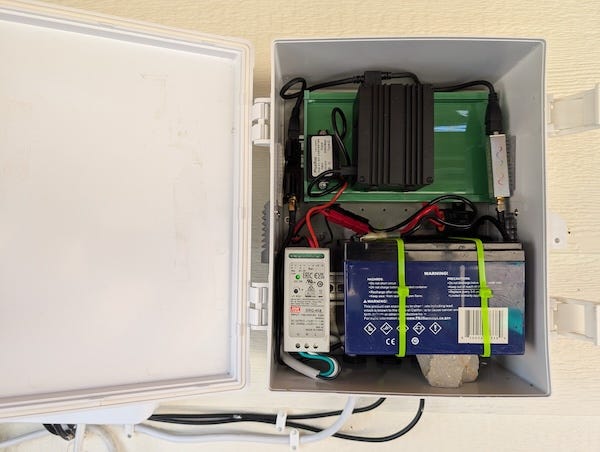
Out by the greenhouse I have two home-brew systems doing very different jobs. One handles irrigation and related sensing. The other is a standalone ADS-B feeder. Both run in weatherproof boxes with solid DC power and battery backup.
This story is about the second one.
I was outside doing routine maintenance on the ADS-B box. Updating software, tightening things up, cleaning out the annual mud dauber infestation. The kind of “quick task” that never stays quick.
That was when it became obvious how underused the ADS-B hardware really was. A quick look at the load average showed the Pi barely breaking a sweat, maybe seven percent utilization.
That is not workload. That is loitering.
This thing is begging for a project.
Meanwhile, over the irrigation side, rainfall was still a blind spot. That system relied on the same hygroscopic disc sensors you find on most sprinkler controllers. They can tell you that it rained, but not how much.
And the amount matters. Rainfall drives irrigation decisions, especially for water-sensitive crops like melons. I wanted real numbers, not a binary “wet or dry” signal.
I also liked the idea of treating weather data the same way I treat ADS-B data: collect it locally and share what I choose to share.
But I was not about to bolt weather sensing onto the irrigation controller or put anything critical on the open internet and invite the “psychic spies from China.” What I wanted was a local view of the weather data I actually care about, stored on my hardware, presented my way. The Ambient display we had been using was a decent stopgap, but it does not give me the flexibility or insight I want out here.
So the obvious next step was an isolated weather station. If it ever gets poked, it will not take the irrigation system down with it.
Discovering the WS90
Once I decided this needed to become a proper weather station, the first step was obvious: find an outdoor sensor unit that was not garbage. My first thought was to repurpose the Ambient unit we already had. The plan was simple: pull the RF off it with another SDR and feed it into the Pi.
Simple plan. Reality disagreed.
The problem showed up fast. I could not get a clean, consistent signal from the Ambient outdoor unit. Half the time the packets I thought were coming from the outdoor sensor were actually coming from the indoor display. Whatever the exact cause, the outdoor RF in my setup was not strong or stable enough to build anything reliable on top of.
Yes, other people have had success pulling Ambient data with rtl_433. In my case it was not giving me the predictable stream I needed.
Maybe it was interference. Maybe distance. Maybe both. I did not care. I had other irons in the fire, and I was not going to burn two weeks debugging RF just to end up with a system I still would not trust.
So, being reasonably hip to modern tools, I asked my friendly neighborhood AI who actually makes a decent remote weather sensor, one I could receive over RF, decode with an SDR, and turn into real data.
The Ecowitt WS90 kept coming up in discussions among people who actually measure things, not just mount plastic gadgets on their decks. The big win for me was that you can buy the WS90 by itself. No console. No gateway. No cloud tether. No subscription hardware riding shotgun. Just an outdoor unit transmitting RF that an SDR can receive and decode cleanly.
A solid, standalone RF weather sensor like this is no longer made in the United States. That pisses me off. Ecowitt builds much of the world’s mid-range weather hardware now. This is where it comes from. China.
We should be building this hardware here.
There is a special place in Hell for the people who decided outsourcing this kind of technology was a good idea. Dante wrote about that place.
For the record, I do not have much trust in anything coming out of the China supply chain. That said, the WS90 is about as low-risk as it gets. It does not join my Wi-Fi. It does not run code on my network. It does not even know my network exists. All it does is transmit RF into the air, which I decode locally with an SDR. One-way traffic. No control channel. An actual air gap.
Given that threat model, I was willing to use it.
The Ecowitt WS90 is a compact, all-in-one outdoor sensor head that covers the basics you actually need on a farm: temperature, humidity, wind speed and direction, solar radiation, UV, and a haptic rain sensor that does not fill up with bugs or freeze into a useless block of ice. There are no moving cups or spoons, nothing to clog, and it even ships with bird spikes.
It has no display and no built-in intelligence. It simply broadcasts raw RF packets every few seconds with whatever it is measuring. That is all it does.
All of the actual “weather station” logic, daily highs, rainfall totals, stateful data, graphs, is computed on the backend.
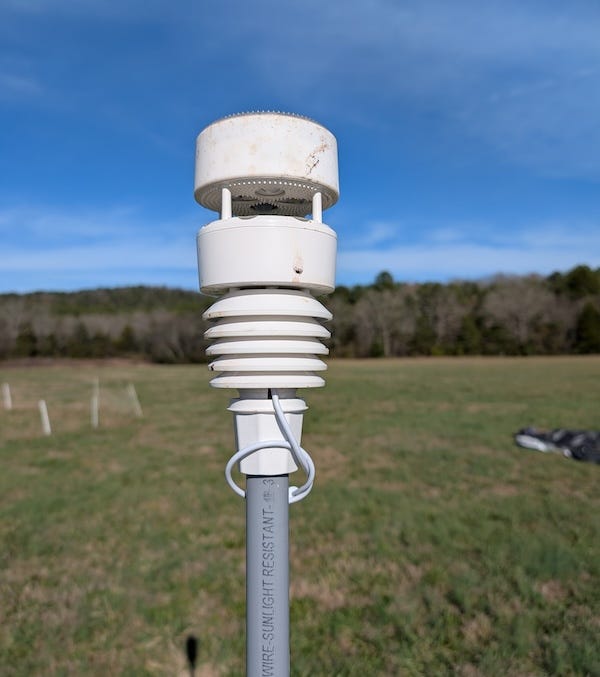
I mounted the WS90 on a simple PVC pipe in the garden. PVC is cheap, rigid enough, easy to replace, and avoids the lightning rod problem that comes with metal mounts. It gets the sensor above ground clutter, where wind and rainfall measurements are not distorted. A couple minutes with a breaker bar and it was doing its job.
About That Missing Barometer
One thing the WS90 does not have is a barometer. At first glance that looks like a missing feature. It is not. It is the right call.
Barometric pressure sensors do not belong outdoors. They drift with temperature swings, get hammered by humidity, and hate direct sun. Put one outside and what you have built is mostly a thermometer pretending to be a pressure instrument.
That is why every serious weather station splits the job. The outdoor unit handles the elements. The indoor hardware handles the barometer, where the temperature is stable. Davis does it. Ambient does it. AcuRite does it. Ecowitt does it. This is not a design flaw. It is physics.
The WS90 leaves pressure measurement to whatever indoor module you choose to pair with it. At some point I will probably hang a cheap BMP380 off another Raspberry Pi indoors, where it actually belongs.
I am not trying to predict rain. I will leave that to the cute weather girls. I just want accurate local conditions, and keeping the pressure sensor inside is how you get them.
It’s a Software Problem
Once the WS90 was in place, this became the fun part.
I already had an SDR on the Raspberry Pi listening to chem-trail pilots broadcast their position and altitude, so adding weather data to the mix was not much of a stretch. The ADS-B stack runs in its own Docker container, and there was no clean way to piggyback another decoder onto that same SDR. Fortunately, those dongles cost about forty bucks. It was easier to plug in a second SDR with a short whip antenna and keep everything separate.
RTL-SDR is one of the great hacks of the last decade. It started life as a cheap TV tuner until someone realized you could ignore the “watch television” part and use it as a wide-band software-defined radio instead. Suddenly you had a general-purpose RF sniffer that could hear everything from garage-door openers, and utility meters to aircraft transponders and weather sensors.
I have written about it before, in my Pi CarRadio project, where I used it to decode FM broadcasts. RTL-SDR refers both to the inexpensive USB dongle and the rtl-sdr software that lets Linux pull raw RF out of the air. It is basically a digital stethoscope for the atmosphere.
That is where rtl_433 comes in.
rtl_433 understands the oddball RF protocols used by consumer sensors. Thermometers, tire-pressure monitors, door sensors, weather stations. If a gadget is chirping on one of the unlicensed ISM bands these devices live on, rtl_433 probably knows how to listen.
In my case, I pointed it at the second SDR and it turned raw RF waveforms into clean JSON containing the WS90’s temperature, wind, rainfall, and everything else it was broadcasting.
At that point, it really was just a simple matter of programming.
Making Sense of it all
The WS90 is not a weather station in the way most people think about one. It does not know about days, totals, or trends. It does not remember anything. It just measures what it can and broadcasts that information as a raw RF packet every few seconds.
That packet is the only thing the WS90 ever produces.
A typical decoded packet from rtl_433 looks like this:
{
  “time”           : “2025-12-12T09:35:23”,
  “model”          : “Fineoffset-WS90”,
  “id”             : 52127,
  “battery_ok”     : 0.92,
  “battery_mV”     : 2880,
  “temperature_C” : 11.3,
  “humidity”       : 63,
  “wind_dir_deg”   : 295,
  “wind_avg_m_s”   : 0.7,
  “wind_max_m_s”   : 1,
  “uvi”            : 2,
  “light_lux”      : 29460,
  “flags”          : 162,
  “rain_mm”        : 125.2,
  “rain_start”     : 0,
  “supercap_V”     : 3.7,
  “firmware”       : 158,
  “data”           : “3fff085622------8a92ffdffd0000”,
  “mic”            : “CRC”
}
That packet contains exactly what the sensor knows at that instant:
Environmental measurements: temperature, humidity, wind, light, UV, and rain impulse state.
Power health: battery voltage, charge state, and supercap voltage.
Identity and versioning: sensor ID, model, and firmware revision.
Housekeeping: flags, raw payload, and a CRC for integrity.
That is the entire input. Just a snapshot of the world at that exact moment.
Everything else, daily rain, highs and lows, trends, and decisions, happens downstream, on my hardware, under my control. Rainfall is the easiest place to see why that matters.
Turning Rain Impulses Into Totals
The WS90 does not measure rain the way most people imagine. There is no bucket filling up inside it. Instead, it uses a haptic sensor, essentially a vibration sensor bonded to a plate. Each raindrop produces a small impulse when it hits. Those impulses are counted and reported as a running rainfall value.
In the decoded data, this appears as the rain_mm field. It is not “today’s rain” or “this storm.” It is a counter that increases as rain continues and is never reset by the sensor. When you first bring a WS90 online, you record the current value and use it as the baseline. From that point on, any increase represents additional rainfall.
The WS90 also reports a rain_start value, which marks when the sensor thinks the current rain event began.
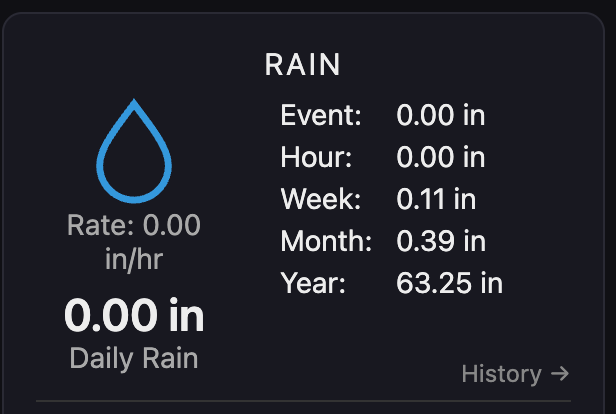
A rain event is calculated by watching rain_mm increase between the rain_start marker and the point where rain stops. Hourly, daily, weekly, monthly, and yearly totals come from accumulating those same differences across fixed time windows.
That is how the rain totals on the screen get computed. None of those numbers are reported directly by the sensor. They are derived by tracking how rain_mm changes over time and applying time boundaries in software.
The Weather System Pipeline
The system is a straight pipeline. Raw RF comes in one end. Usable data comes out the other.
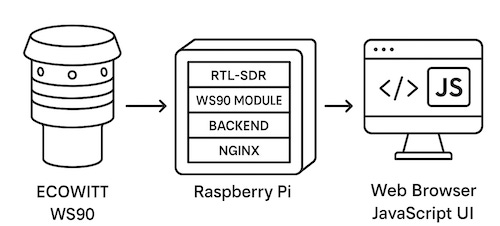
RF decode
This is where it starts. Our RTL-SDR dongle listens to the ISM bands, and rtl_433 decodes whatever it hears and outputs data in JSON format. That could include the WS90, along with any other devices chirping on those same frequencies.
WS90 module
A small program reads the rtl_433 output, keeps only the WS90 packets I care about, and throws everything else away. It makes sure the data is sane, keeps the most recent good reading, and ignores anything that goes stale before handing it off downstream.
Ecowitt backend
This is where the groovy work happens. The backend pulls in the latest WS90 reading from the listener and keeps track of what the sensor says over time. It compares each new reading to the one before it and updates its own records as things change.
Most of this is bookkeeping. Rainfall is calculated from changes in the rain counter, not from a single reading. Daily highs and lows are tracked as the day goes on. Wind is summarized instead of logged endlessly. Rolling averages smooth out noise so the numbers do not jump around every few seconds.
The backend also keeps a small local database. It stores enough history to be useful without trying to become a data warehouse. Recent readings, daily summaries, and rollups live there so trends can be shown and numbers survive restarts.
It also watches for trouble. If readings stop updating or arrive late, that gets noticed and flagged. Nothing is silently filled in or guessed.
What comes out of the backend is exposed through a simple local JSON API. Current conditions, accumulated totals, recent history, and status are all there in one place, ready for the web frontend to read and display.
Web frontend
The backend’s local JSON API is used to generate a simple dashboard, served by nginx and viewed in a browser. The page polls the backend at a steady interval and updates the display in place. The frontend does no computation. It just updates the display.
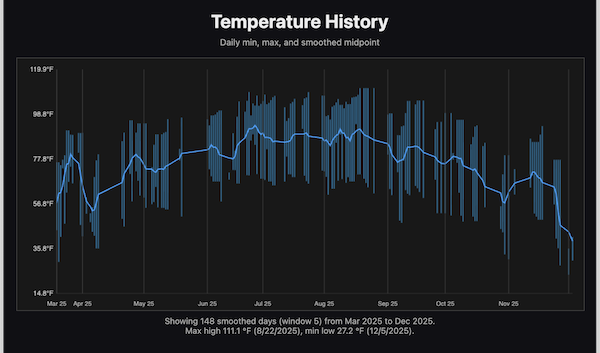
The dashboard makes it easy to see current conditions, recent rain totals, and the overall health of the system. Additional pages show recent history for things like temperature, humidity, and rainfall.
Each stage runs in its own Docker container. The WS90 module, backend, and frontend are isolated so they can be restarted or updated independently. If one component misbehaves, it does not take the rest of the system down.
The Web Dashboard
Once the backend is keeping things straight, you still need a way to see what it’s doing. That is the job of the dashboard.
The first screenshot shows the main dashboard view with current conditions and system status. The second shows the history view, where you can look back at recent temperature, humidity, and rainfall data.
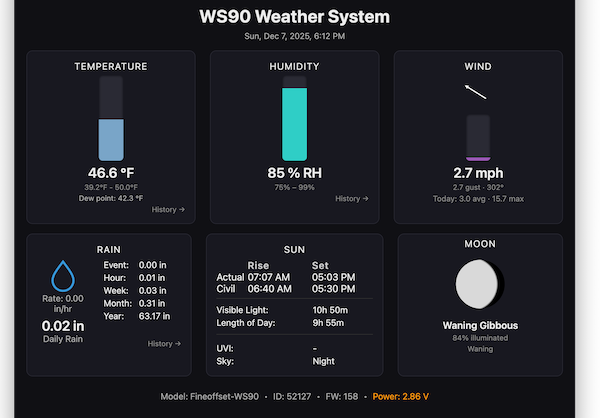
What the user sees is a simple web page showing current conditions, recent rain totals, and basic system health. It works in any browser. Phone, tablet, laptop, what have you.
It is just a web interface, easy to repurpose. In my case, this will probably end up on a small display driven by another Raspberry Pi and hung on the wall. Nothing special required. It is just a browser pointed at the dashboard.
The dashboard itself is intentionally boring. It is read-only, accepts no input, and does no computation. There is nothing to log into, nothing to submit, and nothing to manipulate. Putting it behind a tunnel provides remote visibility without turning it into something that needs constant security attention.
If you want access outside the LAN, this setup works well behind a Cloudflare tunnel. The connection is outbound only, so nothing is exposed directly to the internet and no ports are opened on the firewall. That setup probably deserves its own article.
Crowdsourcing, When It Makes Sense
This setup did not start as a weather project. It started as an ADS-B feeder running in its own set of Docker containers on the Pi. The weather system simply added a few more alongside it.
ADS-B is one of the cases where crowdsourcing actually works. A single receiver does not see much, but thousands of them together build a picture that is genuinely useful. Each feeder is simple, local, and independent. If one goes offline, nothing breaks.
Weather data can work the same way. Local measurements matter, especially in rural areas where official stations are sparse and often far away. Sharing data from a real sensor, in a real location, can help fill those gaps.
The important part is that this is optional. My weather station does not depend on being online, and it does not depend on anyone else’s cloud. If I choose to feed data outward, it is one-way. In my case that means services like Weather Underground or Windy, but nothing here is locked to a particular platform. If you want something different, it is easy enough to write your own feeder.
Crowdsourcing should be a contribution, not a dependency. The system works for me first. Sharing data is something I can turn on or off without changing how the farm runs.
Wrapping It Up
This started the way a lot of real projects start. I was out there fixing one small thing on a box that was already doing useful work. That exposed unused capacity, missing data, and a few rough edges that were easy to live with until they weren’t. And then the inevitable question came up: what if?
The weather station was not the plan. It was simply the next sensible move. The hardware could handle it, the data mattered, and the off-the-shelf options were never going to give me the control or visibility I wanted. So the system grew, piece by piece, into something solid and genuinely useful.
Next up. Hook it up to a small hardware dashboard on the kitchen wall, something always on and easy to glance at. How could I resist another cool project.
If you want to see what comes next, stick around. More projects are coming. In the meantime, go poke around the other builds. And yes, they will almost certainly start with “I was just going to fix one small thing.”
I occasionally have seen the pi disconnect USB from the SDR.
doing
sudo dmesg -wT | egrep -i "usb|disconnect|reset|2838|Nooelec"
I would see
usb 1-1.4: USB disconnect, device number 12
usb 1-1.4: new high-speed USB device number 13 using xhci_hcd
usb 1-1.4: Product: SMArt XTR v5
--
best I can tell :
- RTL-SDR dongles draw current in short bursts
- rtl_433 defaults to wide bandwidth and AGC
- Gain changes and packet bursts cause sharp current spikes
- The Pi 4 USB power switch detects the spike and momentarily cuts VBUS
- The SDR resets and re-enumerates cleanly
I updated the rtl_433 settings in weather/ws90/entrypoint.sh. to:
rtl_433 \
-f 433920000 \
-s 1024k \
-g 20 \
-R 161 \
-M time:iso
1. `-s 1024k` (sample rate)
- Sets the SDR IQ sample rate to **1.024 MSPS** (1,024,000 samples/sec).
- rtl_433 often defaults to **2.4 MSPS** if you do not specify `-s`.
- Effect:
- Lower ADC and USB throughput load
- Lower average and peak current draw inside the dongle
- Less heat
- Fewer USB power transients
2. `-g 20` (manual gain, disables AGC)
- Sets a **fixed tuner gain** value (here, 20 dB in rtl_433/rtl-sdr units).
- Using `-g` disables the automatic gain control behavior that otherwise jumps gain up/down.
- Effect:
- Eliminates gain “step” transients triggered by bursty packets
- Makes current draw more stable and predictable
- Notes:
- You may need to tune this (typical working range is ~15 to 30) depending on antenna and sensor distance.
3. `-R 161` (restrict decoders)
- Enables **only** decoder number **161** (Ecowitt/WS90-class protocol) instead of running the full “try everything” decoder set.
- Effect:
- Reduces CPU/DSP work per received burst
- Reduces short-lived processing spikes during packet bursts
If this works for a few weeks without issue -- I will update the github