
Raspberry Pi Internet of Things - part 15
Recording and accessing environmental data remotely


So far in this series, I have focused on collecting environmental data from devices and how to access it remotely. I explored this topic in depth in the following chapters:
In my design process, I was committed to making the system self-hosted. I really wanted to avoid storing my data on a third-party cloud server, not because I was worried about privacy, which could be easily managed with strong encryption and careful protection of the private key. (not your key, not your data) Rather, I want to make the system resilient to remote denial of service attacks and ensure it functions without external internet access.
So in this installment, I will write about how the piotserver stores and tracks the data it collects locally and how it makes it available for display.
The REST API redux
Let’s start by reviewing how the piotserver REST API works. Let’s assume we have a server on our local network with a local DNS name of royal9.local and that it listens for REST queries on port 8081.
If we take a simple device, such as the rain sensor switch, we can retrieve the current state of the sensor by issuing the following GET query to our piotserver.
http://royal9:8081/values/?RAIN_SENSOR{
"success": true,
"values": {
"RAIN_SENSOR": {
"display": "true",
"time": 1748812949,
"title": "Orbit Rain Sensor",
"value": "1"
}
}
}The response to this query tells us that the current state of the rain sensor is wet, and was last set at a timestamp of 1748812949 or Sun Jun 01 2025 16:22:29 CDT. However, it would be useful to know the history of this value, such as how long or how often it has been raining this month.
This is why I added a value tracking feature to the piotserver project. To illustrate an example of this, let’s look back at part 8 of this series, where I hooked up the rain sensor to one of the pins of an MCP23008 I²C device. The config file entry for this device looked like the following:
{
    "device_type": "MCP23008",
    "address": "0x20",
    "title": "NCD Relay+I/O",
    "pins": [
   ...
      {
            "bit": 7,
            "data_type": "BOOL",
            "key": "RAIN_SENSOR",
            "title": "Orbit Rain Sensor",
            "gpio.mode": "input",
            "tracking": "track.changes"
        }
    ]
}
Note that the JSON value for “tracking” is set to “track.changes”. This informs the server to record whenever the value for RAIN_SENSOR changes state. When data is returned from a device, the way the server records its value depends on the setting of that value’s corresponding “tracking” field.
The “tracking” field can have the following options:
"ignore" - Ignore this value
"don’t.record" - make available through REST API, but don’t record the value.
"track.latest" - record only the latest value
"track.changes" - record any significant changes to this value.
"track.range" - keep track of the day’s highs and low values.
The Database
The piotesever uses the SQLite database engine library. The server creates a file named piotserver.db.
Incidentally, you might also be interested in my article about SQLite.
SQLite is the most deployed database engine in the world and is used on a plethora of applications ranging from mobile phones to web browsers to even embedded systems. The fact that is compact library written in the C language rather than a server makes it ideal for small applications like you would find on the Raspberry Pi.
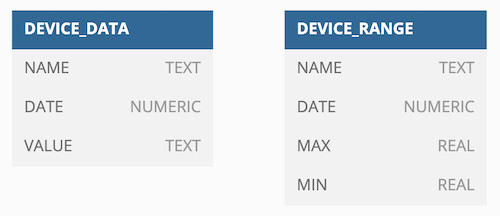
The server defines two tables in the database: DEVICE_DATA is used to track any significant changes recorded from the devices, and DEVICE_RANGE is used to track the high and low values of the day.
Or in SQL terminology:
CREATE TABLE DEVICE_DATA(NAME TEXT NOT NULL,
		         DATE NUMERIC NOT NULL,
			 VALUE TEXT NOT NULL);

CREATE TABLE DEVICE_RANGE(NAME TEXT NOT NULL,
			  DATE NUMERIC NOT NULL,
			  MIN REAL NOT NULL,
			  MAX REAL NOT NULL);
DEVICE_DATA
For some sensors, we are only interested in tracking when the value changes. Again, using our example of the binary rain sensor, which can indicate that it’s either wet or dry. If we define that sensor in the config file with the tracking set to track.changes, then whenever the value changes, its new value and the timestamp will be inserted into the DEVICE_DATA table.
After I had the piotserver record 3 months of rain data, I dumped the DEVICE_DATA table using the following query into the sqlite3 command line app:
>select * from DEVICE_DATA WHERE NAME = 'RAIN_SENSOR';

RAIN_SENSOR|1743357541|1
RAIN_SENSOR|1743366039|0
RAIN_SENSOR|1743630410|1
RAIN_SENSOR|1743945096|0
RAIN_SENSOR|1743945166|1
RAIN_SENSOR|1744040589|0
RAIN_SENSOR|1744103469|1
RAIN_SENSOR|1744104210|0
RAIN_SENSOR|1744104990|1
RAIN_SENSOR|1744114509|0
RAIN_SENSOR|1744192140|1
RAIN_SENSOR|1744200750|0
RAIN_SENSOR|1744802140|1
RAIN_SENSOR|1744802510|0
RAIN_SENSOR|1745184840|1
RAIN_SENSOR|1745268838|0
RAIN_SENSOR|1745722253|1
RAIN_SENSOR|1745786464|0
RAIN_SENSOR|1746046724|1
RAIN_SENSOR|1746140954|0
RAIN_SENSOR|1746192694|1
RAIN_SENSOR|1746296244|0
RAIN_SENSOR|1746562162|1
RAIN_SENSOR|1746725606|0
RAIN_SENSOR|1746731586|1
RAIN_SENSOR|1746809896|0
RAIN_SENSOR|1747048496|1
RAIN_SENSOR|1747149416|0
RAIN_SENSOR|1747566946|1
RAIN_SENSOR|1747613346|0
RAIN_SENSOR|1747718606|1
RAIN_SENSOR|1747776546|0
RAIN_SENSOR|1748102400|1
RAIN_SENSOR|1748467650|0
RAIN_SENSOR|1749069575|1
RAIN_SENSOR|1749152395|0
RAIN_SENSOR|1749229525|1
RAIN_SENSOR|1749333335|0
RAIN_SENSOR|1749348465|1
RAIN_SENSOR|1749414365|0
RAIN_SENSOR|1749734605|1
RAIN_SENSOR|1749848505|0
RAIN_SENSOR|1749935401|1
RAIN_SENSOR|1750021931|0
RAIN_SENSOR|1750032590|1
RAIN_SENSOR|1750173763|0
RAIN_SENSOR|1750185832|1
RAIN_SENSOR|1750283517|0
RAIN_SENSOR|1750357967|1
RAIN_SENSOR|1750449777|0
sqlite>
So what does this tell us? Let’s start at the top. The timestamp of the first entry has a value of 1, which means it was wet, and the date of 1743357541 ( Sun Mar 30 2025 12:59:01 CDT). The following entry has a value of 0, and a date of 1743366039 ( Sun Mar 30 2025 15:20:39) ... The sensor got wet at 12:59 AM and dried out at 3:20 PM.
And so on…
DEVICE_RANGE
There are other sensors where knowing the daily range would be helpful. For example, I use an SHT30 sensor to track the temperature in our greenhouse. I set the tracking option in its config file entry to “track.range”.
{
  "address": "0x44",
  "device_type": "SHT30",
  "pins": [
    {
      "data_type": "TEMPERATURE",
      "interval": 30,
      "key": "GARDEN_TEMPERATURE",
      "title": "Garden Temperature",
      "tracking": "track.range"
    },
..
  ]
 },
So, again, let’s examine the DEVICE_RANGE table using the following query in the sqlite3 command line app:
> select * from DEVICE_RANGE where NAME="GARDEN_TEMPERATURE";

GARDEN_TEMPERATURE|1742515182|6.90585|24.6101
GARDEN_TEMPERATURE|1742586196|-1.34546|24.6101
GARDEN_TEMPERATURE|1742687386|5.1648|23.8705
GARDEN_TEMPERATURE|1742773075|23.08|25.2483
...
GARDEN_TEMPERATURE|1745020800|2.166018|33.112459
GARDEN_TEMPERATURE|1745107230|2.166018|33.112459
GARDEN_TEMPERATURE|1745280028|9.891279|30.108339
GARDEN_TEMPERATURE|1745366438|7.86717|32.346075
The first entry on 1742515182 shows a MIN of 6.90585 and a MAX of 24.6101. This means that on 3/20/25, the garden temperature dropped to 44.4°F and had a high of 76.2°F. The next day, it fell to 29.5° and reached a high of 76.2°F. (Yeah, welcome to Arkansas!)
Getting Sensor Data from the REST API
Wouldn’t it be cool to get and display this data remotely on a web page? If you remember from part 8, there is a REST API. I wrote about how to make a REST query to get the current value of a sensor.
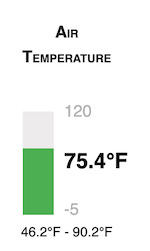
GET /values/?GARDEN_TEMPERATURE

{
  "success": true,
  "values": {
    "GARDEN_TEMPERATURE": {
      "display": "73.03°F",
      "time": 1745419498,
      "title": "Garden Temperature",
      "value": "22.794308"
    }
  }
}
A range REST API also exists to access the sensor’s daily range.
GET /range/?GARDEN_TEMPERATURE
{
  "success": true,
  "values": {
    "GARDEN_TEMPERATURE": {
      "max": 32.346075,
      "min": 7.86717
    }
  }
}
Using these two APIs, you now have enough data to display something like the following:
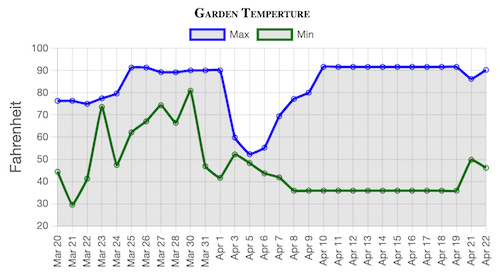
However, if we wanted to access the GARDEN_TEMPERATURE historical data, we would use the history REST API. This returns the corresponding entries from the DEVICE_RANGE table.
GET /history/GARDEN_TEMPERATURE
{
  "success": true,
  "key": "GARDEN_TEMPERATURE",
  "title": "Garden Temperature",
  "units": "DEGREES_C",
  "range": [
    {
      "max": 23.9879,
      "min": 23.9879,
      "time": 1742336789
    },
  ....
    {
      "max": 32.346075,
      "min": 7.86717,
      "time": 1745366438
    }
  ]
}
Using the data returned from the history API. I was able to take the JSON array of min, max, and time values returned in the range field and plot a graph of the daily Garden Temperature ranges.
On the other hand, if I had requested the history of a sensor that did not track ranges, like the RAIN_SENSOR, the API would return entries from the DEVICE_DATA table.
GET /history/RAIN_SENSOR
{
  "success": true,
  "key": "RAIN_SENSOR",
  "title": "rain sensor",
  "units": "BOOL",
  "values": [
    {
      "time": 1743357541,
      "value": "1"
    },
    {
      "time": 1743366039,
      "value": "0"
    },
    {
      "time": 1743630410,
      "value": "1"
    },
   ...
    {
      "time": 1745268838,
      "value": "0"
    }
  ]
}
I am still working on how RAIN_SENSOR data should be visualized. (Please comment if you have any ideas.) I am leaning towards a bar graph that displays how much time has passed between rain days and how long it took the sensor to dry out. But I am not yet sure.
The REST API also supports days, limit, and offset as parameters in the HTTP headers. These are helpful when you want to limit the response to only the history you are interested in. These HTTP parameters can be used in conjunction with the API to get the number of entries that would be returned for a query.
GET /history/count/RAIN_SENSOR

{
  "success": true
  "count": 50,
}
What if I told you..
The REST API consists of much more than I have written about. For example, you can make a DELETE REST call to prune out sections of the database. While the REST API is idempotent, the results are not reversible. Once you delete the entries, they can not be recovered.
This brings us to the ideal segue to discuss security. Protecting the REST API from unauthorized access deserves an article dedicated to this subject. That one is on my list for the near future.

This post is part of the Off-Grid Farm Automation with Raspberry Pi series — a full DIY walkthrough of building a self-hosted system for sensors, valves, and automation, no cloud required.