

I have written a lot about my home-brewed garden irrigation system. I have discussed the sensors, the custom circuit boards and software, and, Lord knows, spent far too much time talking about irrigation valves.
Now that we have the machinery worked out, the next question is how the farmer sees and controls it.
What’s going on in the garden?
The system’s web dashboard answers that question. It gives me a single place to see current conditions, check what the system has been doing, review problems, manage schedules, and take control when necessary.
The dashboard is only the operator’s view. pIoTServer handles the actual automation and sends Pushover notifications to my phone when something goes wrong.
Like the rest of the systems I build, this one is self-hosted. I do not outsource its control, its data, or its availability to a third-party vendor or cloud service. The dashboard runs on my own hardware and talks directly to pIoTServer through its REST API.
10,000-Foot View
At a high level, farm-web is your basic web application. It is a collection of HTML, JavaScript, and CSS files served by nginx from a Docker container. The browser uses it to make REST requests to pIoTServer, which remains responsible for the actual automation.
Using standard web technologies means the dashboard can run almost anywhere, on a desktop computer, laptop, tablet, or phone. It could also be displayed on a dedicated kiosk, much like the weather station I built for my kitchen, and mounted in the greenhouse or anywhere else a permanent farm display would be useful.
The code in farm-web does not contain the irrigation logic, maintain schedules, or decide when a rule should run. It presents information and sends operator requests. My automation system, pIoTServer, continues operating whether farm-web is available or not.
The dashboard is also not where the system is configured. Devices, schedules, rules, and other operating details are defined in pIoTServer’s configuration. farm-web lets the operator see and interact with the system, but it does not define how the system itself works. It is a tool designed for the farmer, not the programmer.
From the farmer’s perspective, the dashboard is organized into a handful of major areas. Sensors provide visibility into current conditions. Devices allow direct control of equipment. Schedules and rules show what the automation system is planning to do. Additional administrative pages provide access to system health, incidents, tracking information, and other management functions.
We will start with the Sensors page.
Environmental Sensors
The sensors themselves are defined in the pIoTServer configuration file. I covered how pIoTServer devices and properties are configured in an earlier article, so I will not repeat all of those details here.
Current environmental sensor support includes TMP10X temperature sensors, SHT25 and SHT30 temperature and humidity sensors, BME280 environmental sensors, VEML6030 light sensors, tank depth sensors, analog measurement devices based on the ADS1115 and MCP3427, and 1-Wire devices connected through a DS2482 bridge.
For the dashboard example, we will use the SHT30 that measures temperature and humidity in the garden. Its device definition appears in the pIoTServer configuration file as a JSON object:
"devices": [
    {
      "address": "0x44",
      "description": "Outside Environment Sensor",
      "device_type": "SHT30",
      "pins": [
        {
          "data_type": "TEMPERATURE",
          "key": "GARDEN_TEMPERATURE",
          "title": "Garden Temperature",
          "tracking": "track.range"
        },
        {
          "data_type": "HUMIDITY",
          "key": "GARDEN_HUMIDITY",
          "title": "Garden Humidity",
          "tracking": "track.range"
        }
      ],
      "title": "Garden"
    }
  ]
This tells pIoTServer that an SHT30 is connected at I²C address 0x44. Some devices provide only a single measurement, while others expose multiple functions. The pins array defines the individual properties produced by the device.
In this case, the SHT30 provides two properties: GARDEN_TEMPERATURE and GARDEN_HUMIDITY. Each property is assigned a unique key that can be used elsewhere in the system for automation, tracking, notifications, and dashboard displays.
Once pIoTServer has read the sensor, its individual properties are available through the REST API. We can request both values by name:
GET /values?GARDEN_HUMIDITY&GARDEN_TEMPERATUREpIoTServer returns a JSON object containing the current value, formatted display value, title, and timestamp for each property:
{
    "success": true,
    "values": {
        "GARDEN_HUMIDITY": {
            "display": "46.94%",
            "time": 1784316906,
            "title": "Garden Humidity",
            "value": "46.936751"
        },
        "GARDEN_TEMPERATURE": {
            "display": "100.57°F",
            "time": 1784316906,
            "title": "Garden Temperature",
            "value": "38.092622"
        }
    }
}
Notice that the raw temperature value is returned in Celsius, while the display field contains the formatted Fahrenheit value used by the operator interface. The dashboard can use the raw value for calculations and the display value when it simply needs to show the reading.
The sensor values alone do not tell farm-web how they should be organized or displayed. That information also comes from pIoTServer. The pIoTServer configuration contains a ui.sensors object that defines the sensor groups, the properties included in each group, and the type of display used for each value.
For this installation, the Garden group is defined as follows:
"ui.sensors": {
    "garden": {
        "label": "Garden",
        "description": "Outside environment and soil conditions",
        "members": [
            {
                "key": "GARDEN_TEMPERATURE",
                "label": "Air Temperature",
                "kind": "temperature",
                "range": {
                    "min": 0,
                    "max": 120
                }
            },
            {
                "key": "GARDEN_HUMIDITY",
                "label": "Humidity",
                "kind": "humidity",
                "range": {
                    "min": 0,
                    "max": 100
                }
            },
            {
                "key": "RAIN_SENSOR",
                "label": "Rain",
                "kind": "binary",
                "falseLabel": "No Rain",
                "falseIcon": "☀️",
                "trueLabel": "Rain",
                "trueIcon": "🌧️"
            }
        ]
    }
}
Since the web application is not on the same hardware as the pIoTServer, it can’t read that configuration file directly. Instead, it retrieves the sensor layout from pIoTServer through the REST API:
GET /props?ui.sensorsFrom that response, farm-web finds the Garden group and uses its definition to build the display shown below:
The group
labelbecomes the heading at the top of the panel.Each member’s
labelbecomes the title of its card.The
keyidentifies the pIoTServer property displayed by the card.The
kindtells farm-web how to format and present the property value.When present, the
rangedefines the scale used by the gauge.For a binary property,
trueLabel,trueIcon,falseLabel, andfalseIcondefine how its two states are displayed.The property returned by the API may also include a
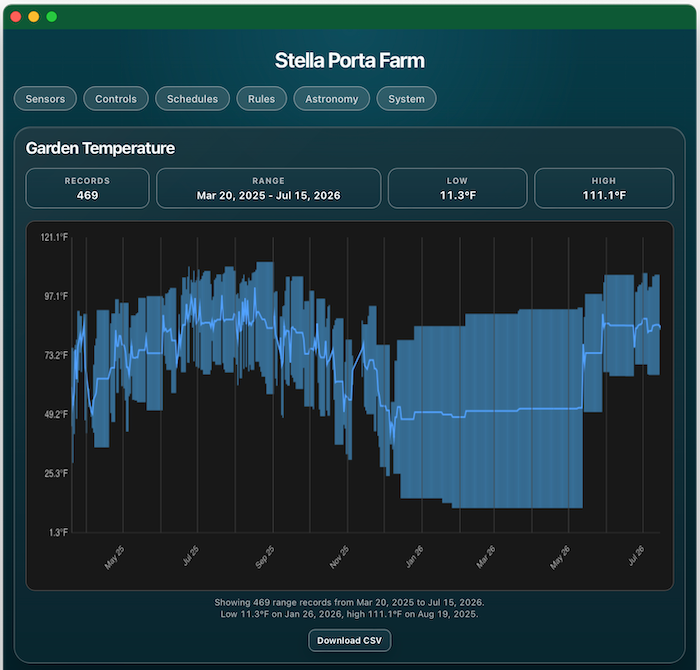
historytag. Whenhistoryis set totrue, the dashboard adds a History button to the card. Selecting it causes farm-web to request the property’s stored readings from pIoTServer and display them as a graph.
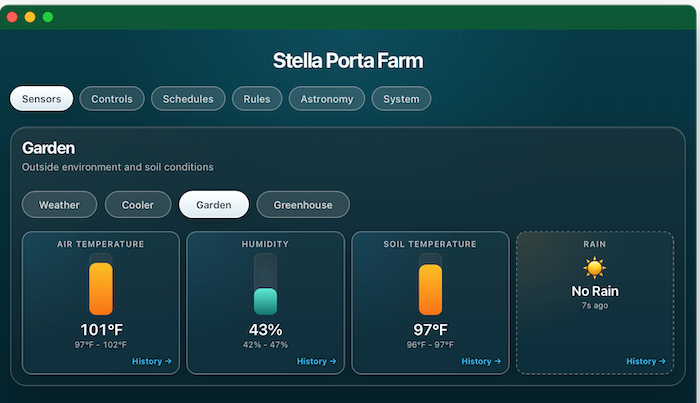
While the range in the sensor definition controls the scale of the gauge, we need to make an additional API call to retrieve the actual daily minimum and maximum values for those sensors.
GET /range?GARDEN_TEMPERATURE{
"success": true,
"values": {
"GARDEN_TEMPERATURE": {
"max": 39.45182,
"min": 21.945144
}
}
}The web application converts those values for display and shows them as the day’s high and low readings on the sensor card.
Binary Sensors
Not every sensor reports a numeric value. Many field devices produce simple binary states such as Wet/Dry or On/Off. The sensor definition can provide labels and icons for both states, allowing farm-web to present binary properties in a form that is much more meaningful than simply displaying true or false.
GET /values?RAIN_SENSOR{
"success": true,
"values": {
"RAIN_SENSOR": {
"display": "false",
"time": 1784321494,
"title": "Orbit Rain Sensor",
"value": "0"
}
}
}The raw property value remains a simple binary value. The ui.sensors definition shown earlier tells farm-web how to display that value. In this case, the kind is binary, and the trueLabel, falseLabel, trueIcon, and falseIcon properties determine the text and icon presented for each state.
Don’t Know Much About History
The current value and the day’s high and low readings show what is happening now. On the farm, however, we also find it useful to understand the longer-term picture.
One of pIoTServer’s more important features is its ability to track the minimum and maximum values reported by a property over time. Many monitoring systems store every individual sensor reading. That can produce a large amount of data while still making a simple question difficult to answer: how hot or cold did it get each day?
pIoTServer can instead maintain a series of range records. Each record contains the minimum and maximum values observed during a period, along with its timestamp. This preserves the information that matters for long-term comparisons without requiring the dashboard to retrieve and process every raw sensor reading.
Range tracking is enabled in the device configuration by setting the property’s tracking mode to "tracking": "track.range". Once enabled, pIoTServer continuously records the property’s minimum and maximum values over time and makes those records available through the REST API.
GET /history/GARDEN_TEMPERATURE Because this history can extend across months or years, the endpoint supports days, limit, and offset parameters:
GET /history/GARDEN_TEMPERATURE?days=30&limit=100&offset=0This allows farm-web to request only the portion of the history needed for the graph.
An abbreviated JSON response looks like this:
{
  "deviceID": "51623",
  "key": "GARDEN_TEMPERATURE",
  "range": [
    {
      "max": 24.6101,
      "min": 6.90585,
      "time": 1742515182
    },
    {
      "max": 24.6101,
      "min": -1.34546,
      "time": 1742586196
    },
    {
      "max": 23.8705,
      "min": 5.1648,
      "time": 1742687386
    }
  ],
  "success": true,
  "title": "Garden Temperature",
  "units": "DEGREES_C"
}
Each entry contains the minimum and maximum values recorded for a period, along with the timestamp for that range. farm-web converts the returned records into the operator’s preferred units and renders them as an interactive history graph. The displayed data can also be exported as a CSV file for further analysis.
Taking Control
Most of the time, the farm operates automatically. pIoTServer evaluates its rules and schedules, monitors the sensors, and decides when irrigation should occur without any intervention from me.
There are times, however, when manual control is useful. I may want to test a newly installed valve, verify that a repair was successful, water a specific plot outside its normal schedule, or simply confirm that a device is operating correctly. The Controls page provides that direct access without changing the automation itself.
As with the sensors, the controls begin with a device defined in the pIoTServer configuration. In this case, an MCP23008 I/O expander provides the output properties used to operate the irrigation valves. One of those properties is GI_4:
  "devices": [
    {
      "address": "0x27",
      "device_type": "MCP23008",
      "key": "GARDEN_27",
      "pins": [
        {
          "bit": 4,
          "data_type": "BOOL",
          "gpio.mode": "output",
          "key": "GI_4",
          "title": "C"
        },
        ...
      ]
    }
  ]
The remaining pin definitions have been omitted for clarity.
Once a property has been defined, it can be read or changed through the pIoTServer REST interface, just as we saw in the article on devices.
At this point we have defined the device and the properties that control it. The remaining question is how those properties become controls on the web dashboard.
Like the Sensors page, the Controls page is configuration-driven. Rather than hard-coding the layout, farm-web retrieves the ui.controls property from pIoTServer and uses it to construct the operator interface.
For this example, we will use the Garden Irrigation control group:
{
  "ui.controls": {
    "garden_irrigation": {
      "label": "Garden Irrigation",
      "control": "valve",

      "members": [
        "GI_8",
        "GI_6",
        "GI_4",
        "GI_5",
        "GI_3",
        "GI_7"
      ],

      "titles": {
        "GI_8": "Plot A",
        "GI_6": "Plot B",
        "GI_4": "Plot C",
        "GI_5": "Plot D",
        "GI_3": "Plot E",
        "GI_7": "Plot P2"
      },

      "descriptions": {
        "GI_8": "BLU",
        "GI_6": "WHT",
        "GI_4": "BRN",
        "GI_5": "ORN",
        "GI_3": "GRN",
        "GI_7": "YEL"
      }
    }
  }
}
The members array identifies the properties that appear in the control group and determines the order in which they are displayed. The titles object provides the operator-facing name for each property, while descriptions supplies the shorter secondary label shown on the control.
The control value tells farm-web which type of widget to use. In this case, valve produces the controls used to open and close the irrigation valves.
From this definition, farm-web constructs the Garden Irrigation section of the Controls page.
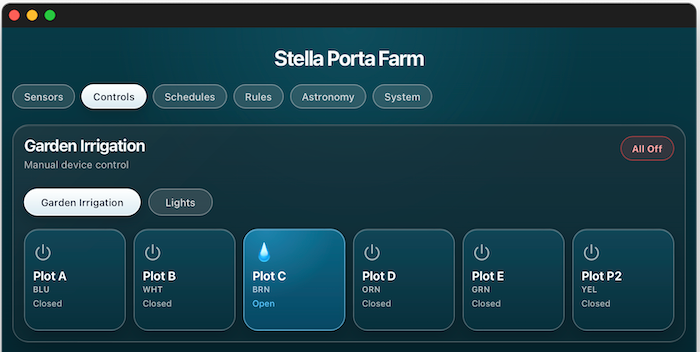
The current Open or Closed status reflects each property’s live value. Selecting a card sends the appropriate request to pIoTServer to operate that valve.
Putting the Farm on Autopilot
Manual control is useful for testing, maintenance, and the occasional one-off watering. Most of the time, however, I want the farm to take care of itself.
As described in the earlier pIoTServer article, irrigation schedules define when work should be performed and the sequence of actions that make up each irrigation cycle. farm-web does not implement that automation. Instead, it presents the schedules in a form that is easy to understand, monitor, and manage.
Like the Sensors and Controls pages, the Schedules page is configuration-driven. The dashboard uses the ui.schedules property to organize related schedules into groups.
"ui.schedules": {
    "evening_garden_irrigation": {
        "description": "PWM sprinkler 9 PM",
        "label": "Evening Garden Irrigation",
        "members": [
            "4002"
        ]
    },
    "morning_garden_irrigation": {
        "description": "PWM sprinkler 9 AM",
        "label": "Morning Garden Irrigation",
        "members": [
            "4001"
        ]
    }
}
The dashboard uses this definition to create the schedule groups and tabs. Each schedule card summarizes the sequence, its current status, and the conditions under which it will execute. The timeline provides a graphical view of the irrigation sequence, making it easy to see when each plot will be watered and for how long. Operators can also temporarily enable or disable a schedule or run it immediately without modifying the underlying automation.
Each entry in ui.schedules references a sequence defined elsewhere in the pIoTServer configuration. The sequence contains the automation itself, including the trigger, any conditions that must be satisfied, and the actions that will be performed.
"sequence": [
  {
    "sequenceID": "4001",
    "name": "Garden irrigation morning sequence",
    "description": "GI_8 through GI_3 for 30 minutes at 9:00 AM",
    "trigger": {
      "time": "09:00 AM"
    },
    "condition": "RAIN_SENSOR == 0",
    "steps": [
      ...
      {
        "action": [
          ...
          {
            "cmd": "SET",
            "key": "GI_4",
            "value": "on"
          }
        ],
        "duration": 1800
      },
      {
        "action": [
          {
            "cmd": "SET",
            "key": "GI_4",
            "value": "off"
          },
          ...
        ],
        "duration": 1800
      },
      ...
    ]
  }
]
In this excerpt, the sequence begins at 9:00 AM only when the rain sensor indicates that irrigation is allowed. The step shown opens the valve represented by GI_4 and leaves it open for 1,800 seconds, or 30 minutes. Then the following step closes that valve before the sequence continues to the next plot.
farm-web reads this sequence information and turns it into the timeline shown on the schedule card. The operator sees when each plot will run and for how long without having to read the underlying configuration.
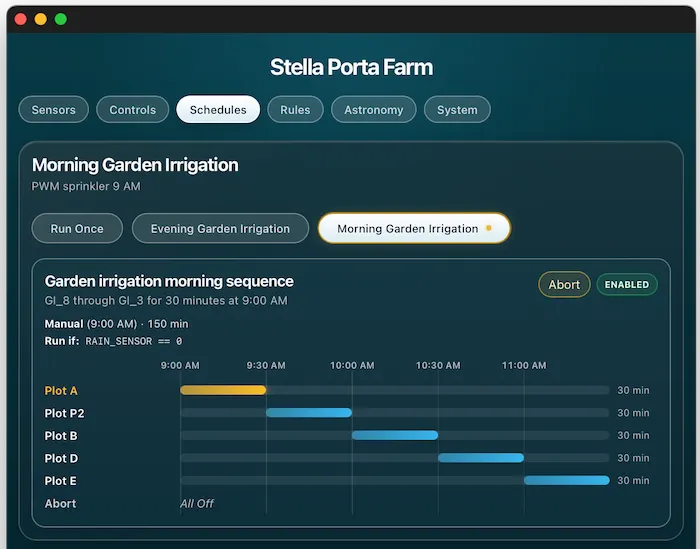
Here the morning irrigation sequence is running. Plot A is highlighted as the active step, while the timeline shows the remaining plots and their scheduled start times. The dashboard combines the sequence definition with the current state reported by pIoTServer, allowing the operator to see what is running, what comes next, and how long each step will last. It also displays the rain-sensor condition and provides an Abort control that stops the sequence and closes all of the valves.
Did It Really Run?
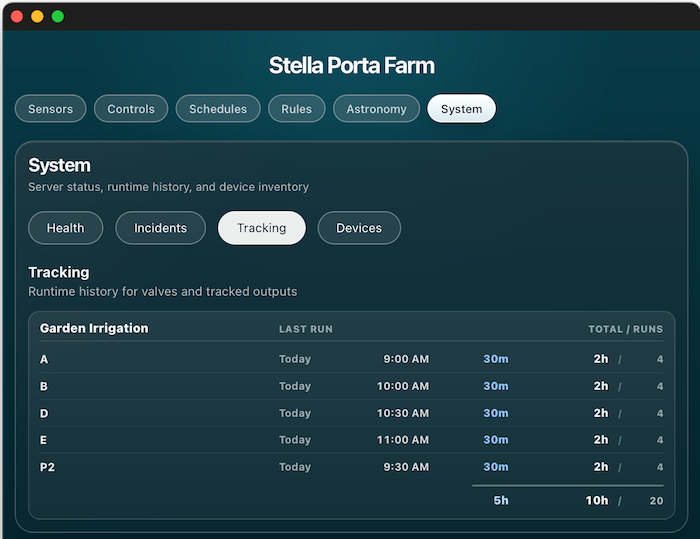
I believe in “trust, but verify”. Once the farm is operating on its own, I still want to know whether the scheduled work actually happened. Did the sequence run? Which plots were watered? How long did each valve remain open?
I don’t have hardware to measure the actual water flow. Fortunately, one of the reasons I moved to Arkansas was access to a good well, so I’m not watching a municipal water bill every month. Even so, runtime is useful. Since the flow rate of each irrigation zone is reasonably consistent, the amount of time a valve remains open provides a good indication of how much water was applied.
To answer those questions, pIoTServer records the runtime history of each tracked output. The dashboard summarizes that information so I can quickly see when each irrigation zone last ran, how long it operated, its total runtime, and the number of recorded runs.
Behind the Curtain
The farm-web code runs in a Docker container, with nginx serving the static HTML, CSS, and JavaScript files. Docker provides a predictable environment and makes deployment and updates straightforward.
nginx also acts as a reverse proxy. It serves the dashboard and forwards its REST requests to pIoTServer. From the browser’s perspective, everything comes from the same web server. The browser does not know where pIoTServer is running, and the pIoTServer REST service is not exposed directly to the public internet.
pIoTServer protects its REST interface with signed requests. Each request includes an API key, a timestamp, and an HMAC-SHA256 signature calculated from the request method, path, and body. pIoTServer calculates the expected signature independently and rejects the request if the signature does not match or the timestamp falls outside the permitted window.
The browser cannot safely hold the shared secret required to create those signatures. Instead, it sends an ordinary request to a small local proxy running alongside nginx. The proxy signs the request and forwards it to pIoTServer. Remote access reaches farm-web through Cloudflare, while the API secret and pIoTServer itself remain on the local network.
Another Piece of the Self-Hosted Farm Puzzle
farm-web has become the primary interface to my irrigation system. It gives me a single place to monitor conditions, manage schedules, verify that the automation is doing what I expect, and investigate problems when they occur. Although it was built for my own farm, it has grown into a general dashboard for pIoTServer that can be adapted to other automation projects simply by changing the configuration.
It is also another example of why I prefer self-hosting. The dashboard runs on my hardware, the data stays on my network, and the farm does not depend on a vendor’s cloud service to keep operating. Remote access is useful, but it does not change who owns or controls the system.
Like the rest of this project, farm-web is open source. If you’re interested in building your own self-hosted automation system, I hope some of the ideas here prove useful. Whether your project is a garden, a greenhouse, a workshop, or something entirely different, the same design philosophy applies: keep the automation independent of the user interface, expose it through a simple REST API, and let the dashboard focus on helping the operator understand what the system is doing.
If you’d like to learn more or build your own system, here are the resources behind this project:
Self-hosting is not effortless. You have to build the system, maintain it, and understand enough of it to fix problems when they occur. The reward is that the farm keeps operating on your terms. The dashboard runs on your hardware, the data stays under your control, and no vendor can decide that a subscription, cloud account, or discontinued service is suddenly required.
That theme runs through much of what I write, whether the subject is electronics, software, baking, perfume, or motorcycles. The subject may change without warning, but the underlying questions are usually the same: How was this made? Why was it built this way? And who gets to control it?
Hitting like and sharing helps real people find the work. The algorithm can go pound sand.
That's why I like the silvers, bc they have that 1.5MB flash memory. I don't think I would ever do any coding in the field outside of a major failure, but then I could.
Have you considered something like a Ti-83 Silver Edition as a super rugged backup terminal OR for any of your outdoor nodes that need something more rugged, especially for an automated backup in a network crash.
I'm just sandboxing in my head, and it sounded like a fun idea.